Better Maps for Better Dancing 🕺💃
Earlier this year a friend of mine (6RAJ) invited me to Amsterdam Dance Event (ADE) that happens every year in Amsterdam. I love Amsterdam, and I love dancing, so obviously this sounded like a lot of fun! ADE isn't just one event though: it's hundreds of events spread throughout the city over several days. So, how was I going to stay organized and figure out all the acts I wanted to go see? Unfortunately the official app offered by ADE isn't good enough to organize, search and bookmark all the events I wanted to go to, so I decided to roll my own. In this post, I'll talk about how I did that, how I used LLMs for the first time in a hobby project and most importantly, whether this thing I built actually helped me organize my trip better (unfortunately the app did not help me dance better 😛).
Why bother? #
As someone who builds software for a living, I always welcome opportunities where I can become the guinea pig myself. That's the primary reason I was so excited to build this particular tool: I knew I was going to immediately use it at the event itself and get a good feedback loop on the user experience. I also wanted to give "vibe coding" a try. By "vibe coding", I mean using Claude Code as an assistant during the process to help me write everything.
Everything I've done can be found in this repository:
and a link to the final product:
Getting the data #
The first thing I did was scrape the official ADE website to get the schedule and and save it as a JSON file I could use later for my own app. This was relatively easy because of an endpoint I found on the website that returns JSON data. The following Python snippet shows how to use it:
import httpx

resp = httpx.get(
    "https://www.amsterdam-dance-event.nl/api/program/filter/",
    params={
        "from": "2025-10-22",
        "to": "2025-10-23",
        "section": "events",
        "type": "8262,8263"
    }
)
The JSON returned looks like this:
{
  "data": [
    {
      "id": 1111111,
      "handle": "events",
      "title": "Event title",
      "subtitle": "Event subtitle",
      "start_date_time": {
        "date": "2025-10-22 00:00:00.000000",
        "timezone_type": 3,
        "timezone": "Europe/Amsterdam"
      },
      "show_start_date_time": true,
      "end_date_time": {
        "date": "2025-10-22 23:59:00.000000",
        "timezone_type": 3,
        "timezone": "Europe/Amsterdam"
      },
      "show_end_date_time": true,
      "url": "https://www.amsterdam-dance-event.nl/en/program/2025/event-title/11111111/",
      "venue": {
        "title": "Venue name"
      },
      "soldOut": false,
      "categories": "Daytime events / Exhibitions / Outdoor / Free Events"
    },
    ...
  ]
}
Already lots of useful information there including title and event categories, but there was one crucial thing missing for creating application: location data. Initially, I tried taking the venue title and using the Nominatim API to find the location. This worked well for many venues, but for others there were errors, so I wanted to find a new method that had a higher accuracy rate.
On the events pages themselves, there's an address for the event venue, so I wrote a second fetch routine that retrieves the page and plucks out the address. After getting the address, I used Google's Places API to get a lat/long point pair from an address. I used this API because I found it to be more accurate than Nominatim and I was well within the rate limits of free usage. To be extra certain that I didn't run over the rate limit usage, I implemented a caching mechanism in my Python script.
The final step was putting this data into a GeoJSON file that my mapping application could use. All of this functionality was wrapped up into a CLI program called ade-mapper with a collect command for collecting event information and writing the GeoJSON and a clean command for clearing the program's cache.
Building the map #
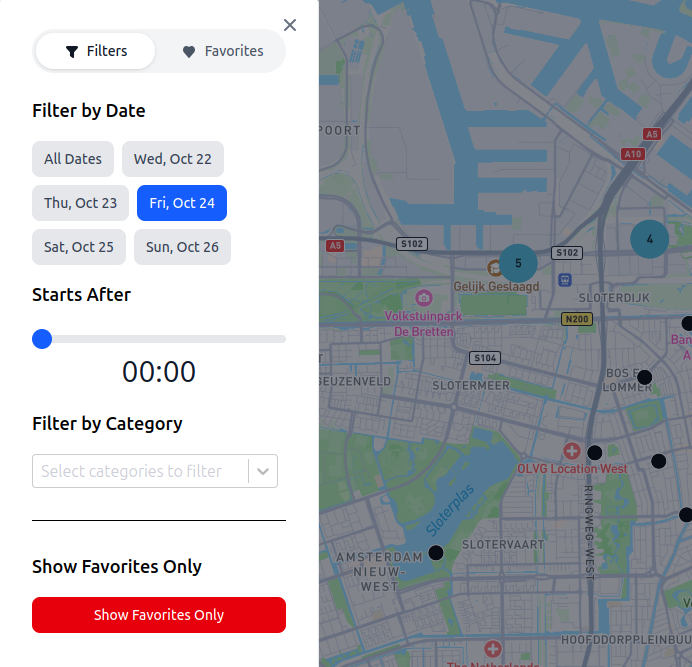
With the data in hand, it was now time to write a simple mapping application that displays it. I had the following requirements in mind:
- Filter events by category, date and start time
- Save events that I want to go see
- See my current position on the map itself
The app itself was just a map similar to Google Maps with a sidebar that you could expand to enable all the filters. Here's a couple screen shots of the interface:
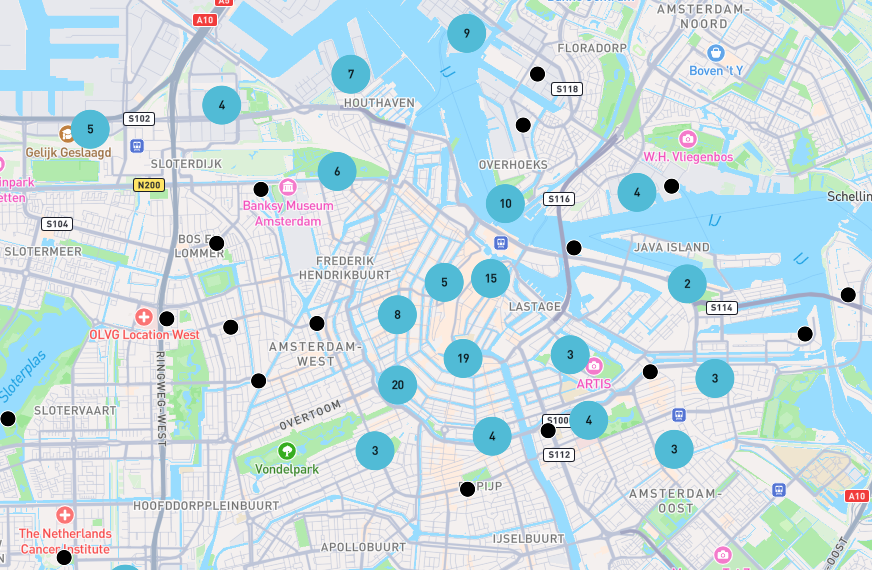
I used point clustering to better display densely packed points. This was actually a big improvement over the official event map that didn't use point clustering, making it difficult to read.
I used Svelte to build the website to get some experience with a new Javascript framework, and my impressions were good! I would definitely like to use it for another project in the future.
This part of the project is where I also used Claude Code considerably. I used it as a tool to help me learn how to use Svelte and also used it to get some ideas about what the user interface should look like. It was very helpful when it came to quickly building different layouts for the app. Claude made a couple mistakes that I had to correct myself, but all-in-all it was a nice tool to have, and I have definitely been using it more since this project.
Actually using it #
So, did this thing actually work? and was it useful? Yes, it was! My favorite thing about the app was the fact that I could zoom to my current location on the map. This ended up being really useful for when I wanted to find an event near me to what events were going on around me. The other really useful thing was being able to filter by category. One of the categories was, "free events", so that ended up being handy for finding cheap events to go to.
Being able to filter by start time was also very useful. Adjusting this filter proved handy as the night progressed, and I was looking for other events to go to. The favorites feature was nice, but I didn't use it as much as I thought I was going to.
This was the first hobby project that I completed in a while, and I had a lot of fun creating and using it. I'm already looking forward to the next excuse to write some more "homemade" software.